You Can Excel In Learning Analytics—Here’s How
Unless you have the world’s best Learning and Development (L&D) function, there are challenges you’re working to solve. Research from Brandon Hall Group shows that measuring the effectiveness of learning is probably one of those challenges.
Measuring learning impact is the number one most common challenge reported by L&D teams. [1] And here’s the scary part: even though it’s the number one area of focus, 42% of organizations have no strategy or standardized approach for learning measurement.
Why is it so hard? And why does it matter?
Well, measuring learning impact matters because learning itself matters. If training wasn’t a critical part of business success, no one would care about measuring its impact. But it is, and they do.
Today, the two largest barriers to business transformation are both related to learning:
- Skill gaps
- Attracting and retaining talent [2]
Both of these barriers tie into the war for talent. But customer education has also emerged as a business-critical function. The average customer education program drives an increase of 6.2% more bottom-line revenue and 7.4% improved customer retention. [3] Most products and services are complex and customers need support and education to get value fast. Or they’ll churn.
So, learning impact matters. And so does measuring it. Here’s why that’s hard:
- The L&D function doesn’t traditionally have easy access to all business data (like sales performance and customer renewal rates).
- Most learning platforms do a poor job of collecting data. And when they do collect it, it’s usually metrics like “time spent learning” that don’t directly connect to business performance.
- Sometimes, L&D people avoid analytics because they think it involves complex math or intimidating software tools. Other times, they’re simply too busy with the other demands of their role.
- Siloed technology can make it hard to integrate learning data with business data. You may have metrics on which customers do the most training and data around which customers renew at higher contract values, but have no simple way to compare the two.
Sound familiar? These reasons are all common and valid. But proving the impact and ROI of learning is easier than you think—and well worth the effort.
Organizations that measure the impact of learning are three times more likely to have strong growth, retention, and profitability. [4]
The “What” And “How” Of Measurement
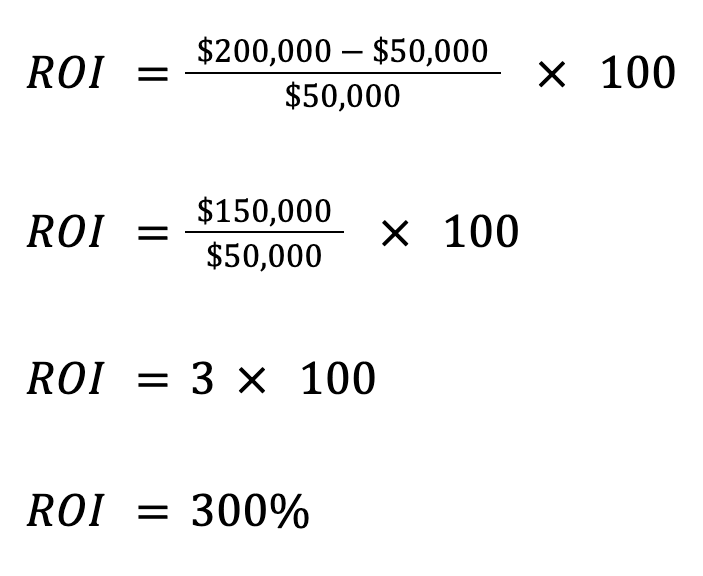
Let’s dispel a common myth: calculating the ROI of learning isn’t complicated. You don’t need to be a data scientist or math whiz. Here’s the formula:

If this looks scary, don’t worry. We promise it’s easy. If your program cost $50,000 to implement but earned you $200,000 in revenue (by leveling up your salespeople), here’s how everything would work out:

The challenge isn’t the math. The challenge is figuring out how to quantify training costs and the benefits of training. Our advice? Be generous with both.
“Training costs” should include the cost of software licenses, content development, admin support, and the budget and salaries of the L&D department (controlled for program time and scope).
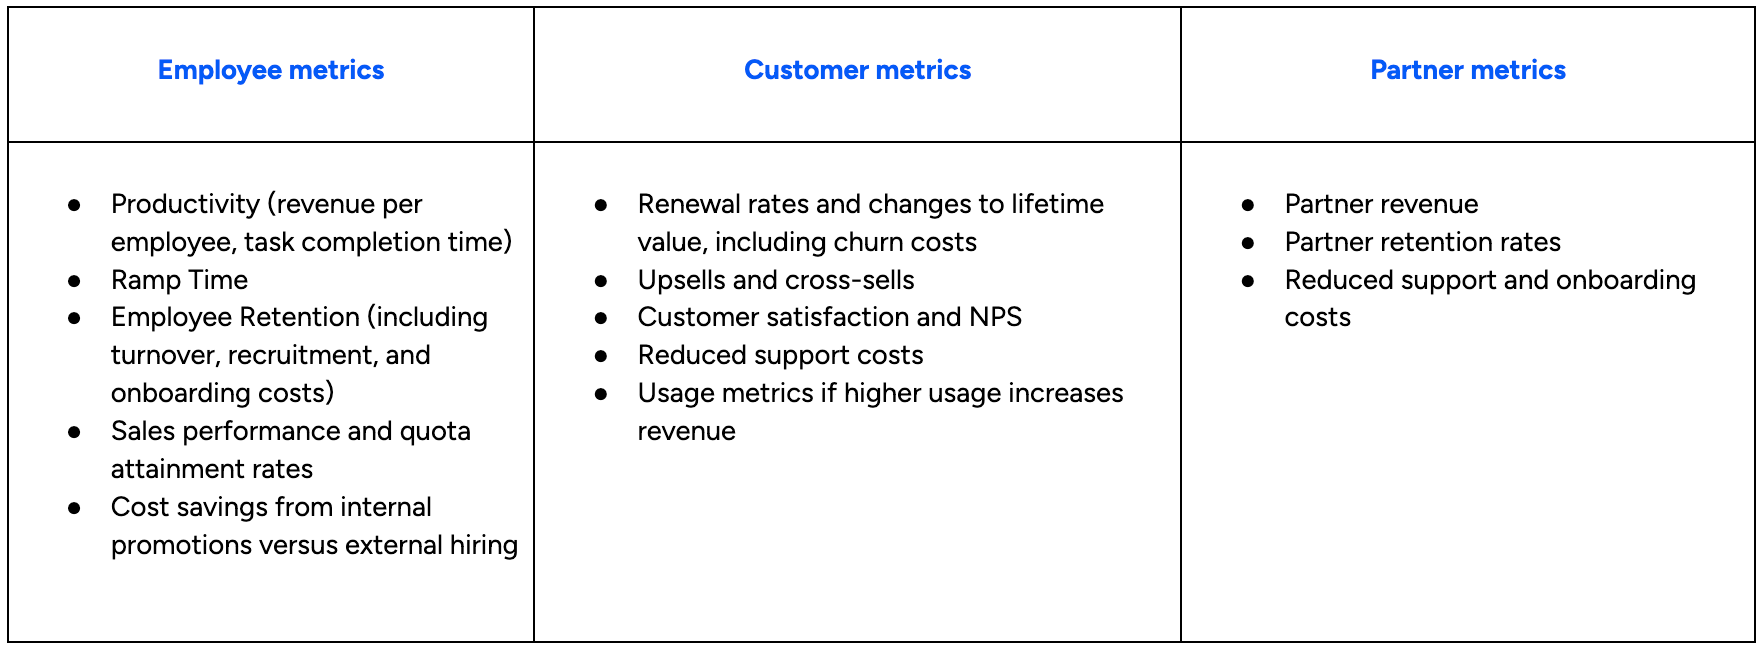
“Benefits of training” should include all the tangible benefits learning creates. Here’s a helpful list by audience:
Odds are, your organization already collects most or all of these metrics. Relating them to learning will make you an L&D rockstar.
Once you look at some of these metrics, you can plug them into the ROI formula. Don’t worry about summing every business metric together; if you haven’t shown learning ROI in the past, even rough measures will be incredibly valuable. For example, you can calculate ROI by audience or even by specific metrics.
You’ll want to look at changes over time. After launching a new learning program or new content to an audience, how did the related metrics shift?
Don’t be surprised if the ROI for individual small metrics (like support cost savings) is negative. The full value will become apparent once you start adding the ROI of different aspects together. And the overall impact of your learning programs is likely to surprise (and amaze!) you. And your boss.
Case Study: Ellucian
Ellucian is a cloud-based software company that helps educational institutions manage finance, IT, student services, HR, recruiting, admissions, and more.
Ellucian has over 3000 employees, which means they generate a lot of data. And to make more strategic decisions and operate more effectively, they wanted to be able to integrate, visualize, and correlate their learning data with important business metrics to understand the ROI of their programs.
Initially, all this data work was done manually. But then Ellucian switched to the Docebo Learning Platform and brought Docebo’s data tools into their business intelligence (BI) infrastructure. We won’t get too technical, but Ellucian centralized their learning data alongside data from platforms like Salesforce and Gainsight. This holistic approach saved them over 130 hours in report generation and data collection.
With this improved data integration, Ellucian unearthed detailed insights about course profitability and revenue trends. It helped them prove and improve the ROI of their learning program.
Tips And Best Practices
Get Visual
Use dashboards and visual analytics to make data accessible and understandable for people across the organization. The best learning platforms have prebuilt visualizations and dashboards to make this easy.
Wherever Possible, Focus On Leading Indicators Over Lagging Ones
Leading indicators happen before the thing you care about and can help you make predictions. Think employee engagement or productivity. These are leading indicators of business success; if your people are working hard now, it will likely lead to success later. Lagging indicators are the opposite: they happen after the thing you care about. For example, revenue growth shows that you did something right, but only after you’ve already done it. With lagging indicators, there’s less room for fine-tuning, predictions, and incremental improvements.
Collect And Use Feedback
Qualitative data can be incredibly valuable. Collect learner reviews and sentiments for your content and use that feedback to continually improve. Although learner engagement may not be easy to link to ROI, it’s a prerequisite for everything that is.
Conclusion
Measuring learning impact is the number one most common challenge reported by L&D teams. Working with data and proving ROI is seen as both difficult and complex. But it doesn’t have to be either.
By using data your business already collects and a simple ROI formula, it’s easy to get a rough estimate of your learning program’s monetary impact. And if you’re willing to dig a little deeper or use a more advanced learning platform (like Docebo), you can get deep insights into how learning impacts every part of your organization and audience.
References:
[1] State of Instructor-Led Training
[3] Learning Science: How to Move Your Customer and Employee Education to the Virtual Space
[4] Why Adaptive Learning Organizations Spend Less and Get More

